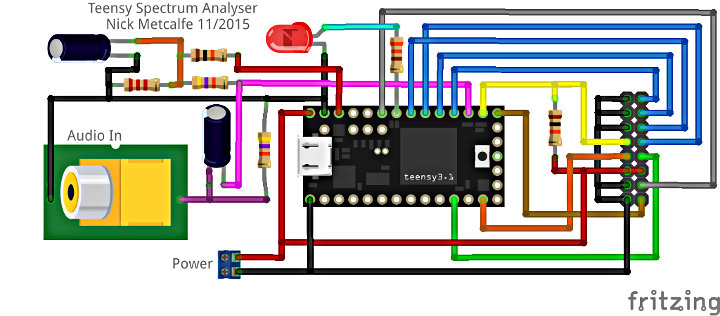
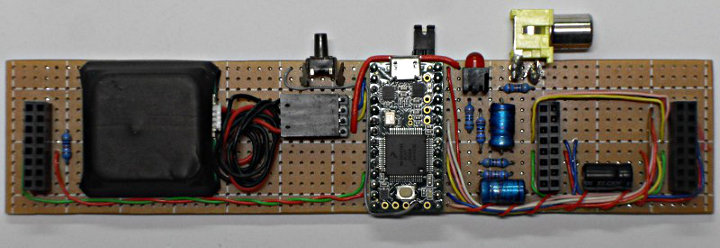
Nick Metchalfe built his own audio spectrum analyzer that produces a detailed picture of what you are listing to in real time, showing the changing spectrum of live input signals up to 16 kHz. By using 2 16×32 LED matrixes, the spectrum displays 64 bands.
This video show the spectrum analyzer in action.
Nick says that the Teensy Audio Library is at the heart of the design, providing audio capture and high resolution FFT routines. Audio frequency data is scaled and binned into logarithmic frequency response groupings and is plotted using a custom fast display driver into a spectrum that approximates the human auditory response for a balanced visual aesthetic.


Nick says that the Teensy Audio Library is at the heart of the design, providing audio capture and high resolution FFT routines. Audio frequency data is scaled and binned into logarithmic frequency response groupings and is plotted using a custom fast display driver into a spectrum that approximates the human auditory response for a balanced visual aesthetic.
He’s posted his spectrum analyzer code on GitHub.